Capital Markets Update – Week of 4/06/2015
Market Overview
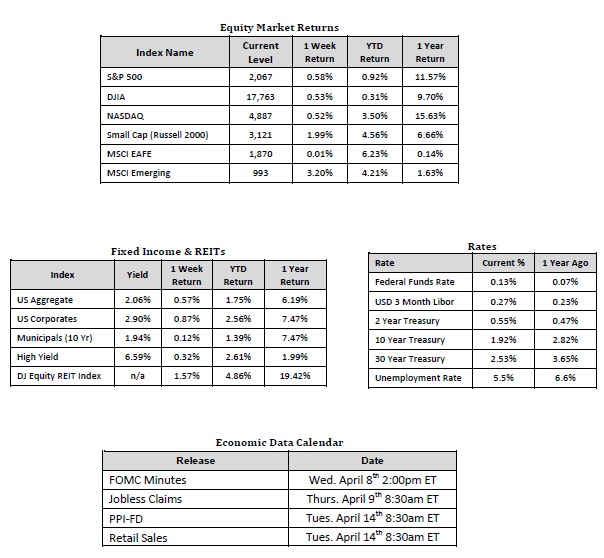
Sources: Rates Data and Economic Calendar—Bloomberg Markets as of 4/06/15; Equity Market, Fixed Income and REIT returns from JP Morgan as of 4/02/15.
Happening Now
Stocks Rose Ahead of March Employment Numbers
U.S. equities finished broadly higher last week with mid and small cap stocks outpacing large caps. The S&P 500 (large cap) returned 0.58%, the S&P 400 (mid cap) returned 1.02% and the Russell 2000 (small cap) returned 1.99%. On the international front developed markets were mostly higher with the French CAC Index (+0.8%), the German DAX Index (+0.83%), and Japanese Nikkei Index (+0.77%) posting positive returns while the UK’s FTSE Index fell (-0.31%) during the holiday shortened trading week.
While markets were closed in the U.S. Friday, the Bureau of Labor Statistics (BLS) was open and, as usual, Wall Street was fixated on the monthly Employment Situation report that was released. The report was viewed as pessimistic by some as it showed that the U.S. added only 126,000 jobs during the month of March, the lowest reported number since December of 2013 and the jobless rate held steady at 5.5%. This caused the yield on the 10 Year U.S. Treasury to fall to 7bps Friday to 1.85% on speculation of fed policy.
While Friday’s release fell short of expectations, we are encouraged to see that the U6 unemployment rate (which encompasses part time and marginally attached workers) fell to 10.9% and the spread between the official unemployment rate (U3) and the U6 number fell to 5.4%. A lot of attention has been paid to how unemployment statistics are calculated and many feel that the U3 rate paints a too optimistic picture. In order to incorporate persons employed but who are working below their skill level (think of an engineer working as a cashier) and those looking for a full-time job but only employed as a part time worker, you have to look to the U6 rate. The U6 rate, by definition, is always higher than the U3 rate and an important consideration is “by how much?” On average, over the past 20 years, the difference between the U6 and U3 has been 4.7% reaching a high of 7.3% in September and December of 2010. Today the spread is down to 5.4%, so while there are structural headwinds that may keep this rate elevated, it appears that there has been significant improvement in the quality of jobs workers are finding.
Important Information and Disclaimers
Past Performance is not a guarantee of future performance.
Investing in foreign securities presents certain risks not associated with domestic investments, such as currency fluctuation, political and economic instability, and different accounting standards. This may result in greater share price volatility. These risks are heightened in emerging markets.
There are special risks associated with an investment in real estate, including credit risk, interest rate fluctuations and the impact of varied economic conditions. Distributions from REIT investments are taxed at the owner’s tax bracket.
The prices of small company and mid cap stocks are generally more volatile than large company stocks. They often involve higher risks because smaller companies may lack the management expertise, financial resources, product diversification and competitive strengths to endure adverse economic conditions.
Investing in commodities is not suitable for all investors. Exposure to the commodities markets may subject an investment to greater share price volatility than an investment in traditional equity or debt securities. Investments in commodities may be affected by changes in overall market movements, commodity index volatility, changes in interest rates or factors affecting a particular industry or commodity.
Products that invest in commodities may employ more complex strategies which may expose investors to additional risks.
Investing in fixed income securities involves certain risks such as market risk if sold prior to maturity and credit risk especially if investing in high yield bonds, which have lower ratings and are subject to greater volatility. All fixed income investments may be worth less than original cost upon redemption or maturity. Bond Prices fluctuate inversely to changes in interest rates. Therefore, a general rise in interest rates can result in the decline of the value of your investment.
Definitions
MSCI- EAFE: The Morgan Stanley Capital International Europe, Australasia and Far East Index, a free float-adjusted market capitalization index that is designed to measure developed-market equity performance, excluding the United States and Canada.
MSCI-Emerging Markets: The Morgan Stanley Capital International Emerging Market Index, is a free float-adjusted market capitalization index that is designed to measure the performance of global emerging markets of about 25 emerging economies.
Russell 3000: The Russell 3000 measures the performance of the 3000 largest US companies based on total market capitalization and represents about 98% of the investible US Equity market.
ML BOFA US Corp Mstr [Merill Lynch US Corporate Master]: The Merrill Lynch Corporate Master Market Index is a statistical composite tracking the performance of the entire US corporate bond market over time.
ML Muni Master [Merill Lynch US Corporate Master]: The Merrill Lynch Municipal Bond Master Index is a broad measure of the municipal fixed income market.
Investors cannot directly purchase any index.
LIBOR, London Interbank Offered Rate, is the rate of interest at which banks offer to lend money to one another in the wholesale money markets in London.
The Dow Jones Industrial Average is an unweighted index of 30 “blue-chip” industrial U.S. stocks.
The S&P Midcap 400 Index is a capitalization-weighted index measuring the performance of the mid-range sector of the U.S. stock market, and represents approximately 7% of the total market value of U.S. equities. Companies in the Index fall between S&P 500 Index and the S&P SmallCap 600 Index in size: between $1-4 billion.
DJ Equity REIT Index represents all publicly traded real estate investment trusts in the Dow Jones U.S. stock universe classified as Equity REITs according to the S&P Dow Jones Indices REIT Industry Classification Hierarchy. These companies are REITSs that primarily own and operate income-producing real estate.


