The Virus may be Peaking, but has the Stock Market Bottomed?
Market Overview

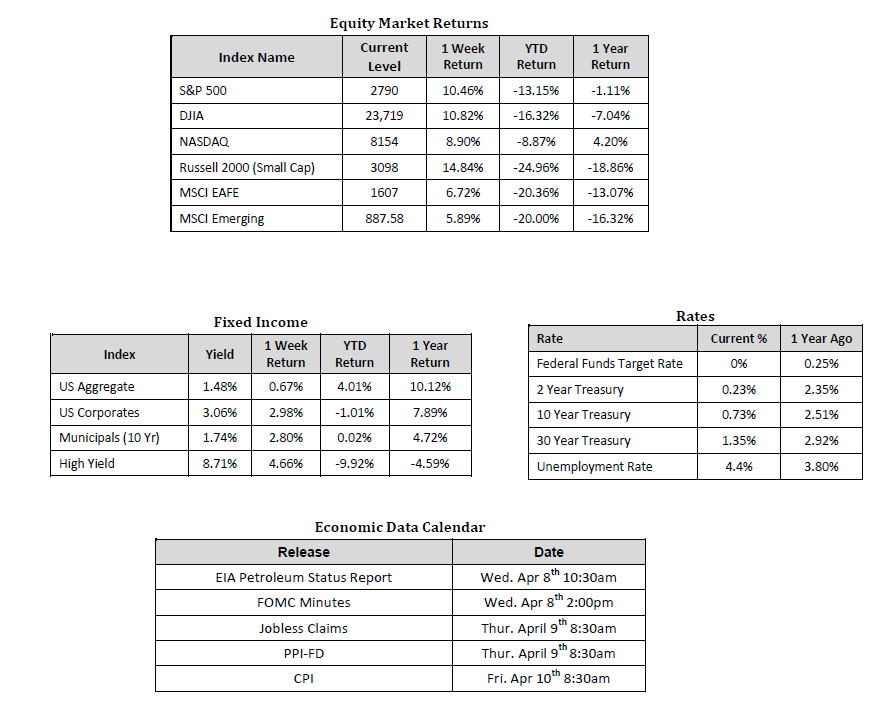
Sources: Sources for data in tables: Equity Market and Fixed Income returns are from JP Morgan as of 04/09/2020. Rates and Economic Calendar Data from Bloomberg as of04/09/2020. International developed markets measured by the MSCI EAFE Index, emerging markets measured by the MSCI EM Index. Sector performance is measured using GICS methodology.
Happening Now
The stock market rollercoaster continued its wild ride last week, as U.S. equities experienced their best performing week in decades. In the U.S., the S&P 500 Index propelled to a level of 2,790, representing a gain of 12.14%, while the Russell Midcap Index increased 17.13% last week. Meanwhile, the Russell 2000 Index, a measure of the Nation’s smallest publicly traded firms, returned 18.53% over the week. Positive performance wasn’t exclusively reserved for U.S. equities, as developed and emerging markets moved 8.30% and 6.83% higher, respectively last week. Finally, the yield on the 10-year U.S. Treasury held relatively firm, only increasing by 0.01% to 0.73%.
As U.S. Legislators and Central Bankers put forth a coordinated and unprecedented effort to help protect the country from the tremendous economic fallout created by the coronavirus, many are starting to wonder if U.S. equities have already seen cycle lows. Historically, forecasted earnings, many of which stem from company issued guidance, have driven stock market valuations. This time around, company forward guidance is highly uncertain, so much so that the SEC issued a statement to public corporations, essentially signaling to corporations to do their best. In other words, the SEC asked that corporations be as accurate as possible in producing forward projections, while also acknowledging that highly accurate projections will be nearly impossible to produce given the current uncertainty associated with COVID-19.
We view this as another reminder that when it comes to successful stock investing, it’s about time in the market, not timing the market. Predictions as to when and where the U.S. stock market will officially reach a bottom are inherently unreliable because they predominately rely on erratic earnings forecasts. Now, what we can say with a degree of confidence is that the U.S. economy will continue to contract for at least the next three to six months. More importantly, we know that, at least historically, quality stocks have outperformed their peers during periods of economic contraction. But, what exactly is a quality stock?
U.S. quality stocks can be defined as the common stock of corporations that exhibit stable and robust balance sheets absent of excessive leverage, a consistent track record of increased and growing profitability, and a skillful and experienced management team in place. Naturally, companies that produce quality products, control operational costs and have consistently delivered positive earnings are going to stand a better chance at weathering an economic storm).
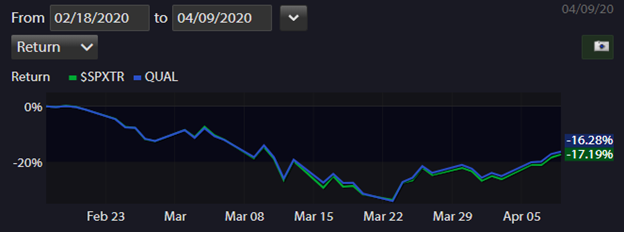
For evidence of this dynamic at work, we can look to the performance of U.S. quality companies, as represented by the iShares USA Quality Factor ETF, compared to the overall S&P 500 Index. As of the market close on April 9th, we can see that the S&P 500 has lost 13.15% year-to-date, whereas U.S. Quality stocks lost 12.97%. Moreover, analyzing the performance differential over the entire selloff period (2/18/2020 – 4/9/2020) shows quality outperforming by nearly a full percentage point. The chart below does an excellent job of showcasing the ability of U.S. quality stocks to take on slightly less downside, which ultimately may lead to outperformance on the upside.

Source: Morningstar as of market close on 4/9/2020. Returns provided are USD total returns and assume reinvested dividends. You cannot invest directly in an index. $SPXTR represents the S&P 500 Total Return Index. Past performance is not an indication of future results.
Building a portfolio comprised of well-run, profitable corporations with strong balance sheets is now more critical than ever, and certainly more important than a wobbly attempt to try and time the market bottom. Anyone who remembers the movie Any Given Sunday remembers Al Pacino’s iconic speech, where he exclaims that winning in the game of football comes down to a battle for inches. The exact quote reads, “You find out life’s this game of inches, so is football. Because in either game, life or football, the margin for error is so small. I mean, one half a step too late or too early and you don’t quite make it. One-half second too slow, too fast and you don’t quite catch it.” Investing is no different, and quality stock investing is a good example of that philosophy. When it comes to investing, it should not be about attempts to outfox the market by entering and exiting at the precise time but rather about building strategic portfolios within an appropriately diversified framework that is consistent with their objectives, time-frame, and tolerance for risk.
As the economy continues to contract, investors will likely continue to reward financially sound and profitable corporations, which is why we believe investors should take this time to evaluate whether their portfolio contains quality U.S. companies. As always, we encourage investors to stay disciplined and work with experienced financial professionals to help manage their portfolios through various market cycles.
Best wishes for continued health and safety to all.
Important Information and Disclaimers
Disclosures: Past performance does not guarantee future results. We have taken this information from sources that we believe to be reliable and accurate. Hennion and Walsh cannot guarantee the accuracy of said information and cannot be held liable. You cannot invest directly in an index. Diversification can help mitigate the risk and volatility in your portfolio but does not ensure a profit or guarantee against loss. Hennion & Walsh is the sponsor of SmartTrust® Unit Investment Trusts (UITs). For more information on SmartTrust® UITs, please visit www.smarttrustuit.com. The overview above is for informational purposes and is not an offer to sell or a solicitation of an offer to buy any SmartTrust® UITs. Investors should consider the Trust’s investment objective, risks, charges and expenses carefully before investing. The prospectus contains this and other information relevant to an investment in the Trust and investors should read the prospectus carefully before they invest.
Investing in foreign securities presents certain risks not associated with domestic investments, such as currency fluctuation, political and economic instability, and different accounting standards. This may result in greater share price volatility. These risks are heightened in emerging markets.
There are special risks associated with an investment in real estate, including credit risk, interest rate fluctuations and the impact of varied economic conditions. Distributions from REIT investments are taxed at the owner’s tax bracket.
The prices of small company and mid cap stocks are generally more volatile than large company stocks. They often involve higher risks because smaller companies may lack the management expertise, financial resources, product diversification and competitive strengths to endure adverse economic conditions.
Investing in commodities is not suitable for all investors. Exposure to the commodities markets may subject an investment to greater share price volatility than an investment in traditional equity or debt securities. Investments in commodities may be affected by changes in overall market movements, commodity index volatility, changes in interest rates or factors affecting a particular industry or commodity.
Products that invest in commodities may employ more complex strategies which may expose investors to additional risks.
Investing in fixed income securities involves certain risks such as market risk if sold prior to maturity and credit risk especially if investing in high yield bonds, which have lower ratings and are subject to greater volatility. All fixed income investments may be worth less than original cost upon redemption or maturity. Bond Prices fluctuate inversely to changes in interest rates. Therefore, a general rise in interest rates can result in the decline of the value of your investment.
Definitions
MSCI- EAFE: The Morgan Stanley Capital International Europe, Australasia and Far East Index, a free float-adjusted market capitalization index that is designed to measure developed-market equity performance, excluding the United States and Canada.
MSCI-Emerging Markets: The Morgan Stanley Capital International Emerging Market Index, is a free float-adjusted market capitalization index that is designed to measure the performance of global emerging markets of about 25 emerging economies.
Russell 3000: The Russell 3000 measures the performance of the 3000 largest US companies based on total market capitalization and represents about 98% of the investible US Equity market.
ML BOFA US Corp Mstr [Merill Lynch US Corporate Master]: The Merrill Lynch Corporate Master Market Index is a statistical composite tracking the performance of the entire US corporate bond market over time.
ML Muni Master [Merill Lynch US Corporate Master]: The Merrill Lynch Municipal Bond Master Index is a broad measure of the municipal fixed income market.
Investors cannot directly purchase any index.
LIBOR, London Interbank Offered Rate, is the rate of interest at which banks offer to lend money to one another in the wholesale money markets in London.
The Dow Jones Industrial Average is an unweighted index of 30 “blue-chip” industrial U.S. stocks.
The S&P Midcap 400 Index is a capitalization-weighted index measuring the performance of the mid-range sector of the U.S. stock market, and represents approximately 7% of the total market value of U.S. equities. Companies in the Index fall between S&P 500 Index and the S&P SmallCap 600 Index in size: between $1-4 billion.
DJ Equity REIT Index represents all publicly traded real estate investment trusts in the Dow Jones U.S. stock universe classified as Equity REITs according to the S&P Dow Jones Indices REIT Industry Classification Hierarchy. These companies are REITs that primarily own and operate income-producing real estate.


