U.S. Stock Rally Continues as Economic Optimism Abounds
Market Overview
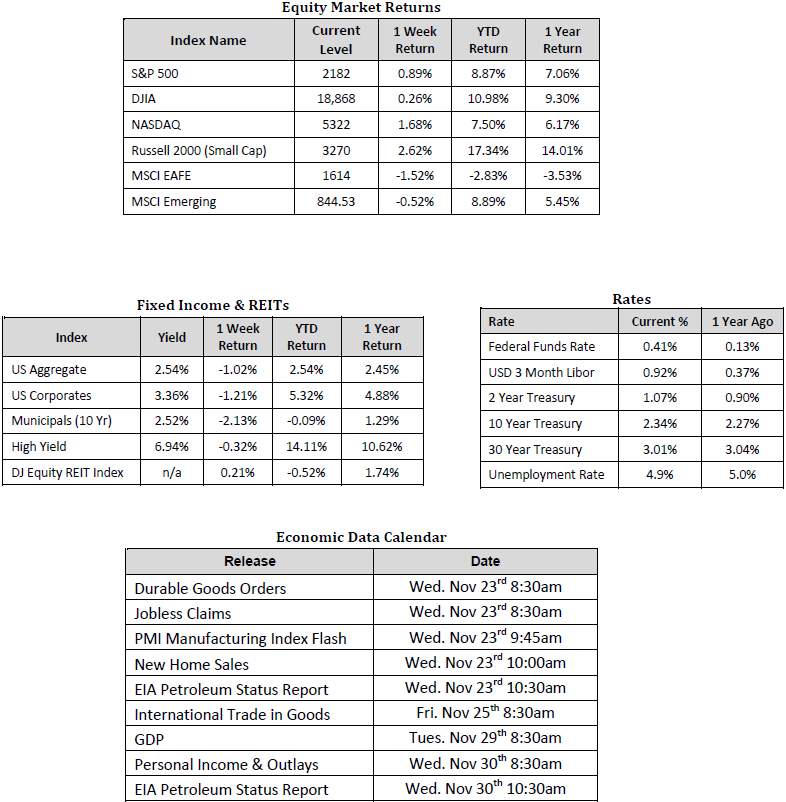
Sources: Equity Market and Fixed Income returns are from JP Morgan as of 11/18/16. REIT, Rates and Economic Calendar Data from Bloomberg as of 11/21/16.
Happening Now
U.S. Stocks continued their post-election rally last week with Large Cap1 companies posting a 0.9% gain, Mid Cap2 stocks gaining 2.0%, and Small Cap3 equities moving 2.6% higher. The U.S. Dollar4 rose 2.2% against a trade-weighted basket of securities for the week and is now up 3.4% since November 8. Interest rates have also continued to move higher with the yield on the 10 year U.S. Treasury reaching a 2016 high of 2.34%. International stocks, on the other hand, continued their downward trend. Developed markets5 fell 1.5% for the week while Emerging markets6 lost 0.5%.
As economic data has continued to be strong, the implied probability for a rate hike at the next Federal Reserve Open Market Committee meeting is now a near certainty according to the CME Group. Retail sales increased 0.8% in October, outpacing the consensus for a 0.6% gain. Core inflation, as measured by the Consumer Price Index (CPI), increased 2.1% year-over-year, consistent with the Fed’s long term target. Housing starts and permits both outpaced estimates while Jobless Claims came in below estimates suggesting further strength in two measures that directly impact millions of Americans.
While many of President Elect Trump’s proposals are seen as positive for growth over the near team, one that investors may immediately benefit from is the repatriation of corporate cash. There appears to widespread support for a one time tax holiday, which would allow corporations to take money now sitting in foreign bank accounts and “bring it home” to the U.S. at a discounted rate, estimated to be in the neighborhood of 10%. This is expected to boost stock buybacks by 30%7 in 2017 and could serve as a major source of return to shareholders during a year that is expected to only produce modest gains in the prices of equities.
We believe that the current investing environment is one of opportunity and risk. While certain asset classes and sectors are likely to provide investors with growth opportunities, others may lead to underperformance. This makes understanding how you are invested across markets, geographies and industries all the more necessary.
The following indexes were used to represent asset class returns: 1Large Cap stock – S&P 500 Index. 2Mid Cap stocks – Russell Mid Cap Index. 3Small Cap stocks – Russell 2000 Index. 4U.S. Dollar – the Bloomberg Dollar Spot Index. 5 Developed markets – MSCI EAFE Index. 6Emerging Markets – MSCI EM Index. 7Source is Wall Street Journal.
Important Information and Disclaimers
Disclosures: Hennion & Walsh is the sponsor of SmartTrust® Unit Investment Trusts (UITs). For more information on SmartTrust® UITs, please visit www.smarttrustuit.com. The overview above is for informational purposes and is not an offer to sell or a solicitation of an offer to buy any SmartTrust® UITs. Investors should consider the Trust’s investment objective, risks, charges and expenses carefully before investing. The prospectus contains this and other information relevant to an investment in the Trust and investors should read the prospectus carefully before they invest.
Investing in foreign securities presents certain risks not associated with domestic investments, such as currency fluctuation, political and economic instability, and different accounting standards. This may result in greater share price volatility. These risks are heightened in emerging markets.
There are special risks associated with an investment in real estate, including credit risk, interest rate fluctuations and the impact of varied economic conditions. Distributions from REIT investments are taxed at the owner’s tax bracket.
The prices of small company and mid cap stocks are generally more volatile than large company stocks. They often involve higher risks because smaller companies may lack the management expertise, financial resources, product diversification and competitive strengths to endure adverse economic conditions.
Investing in commodities is not suitable for all investors. Exposure to the commodities markets may subject an investment to greater share price volatility than an investment in traditional equity or debt securities. Investments in commodities may be affected by changes in overall market movements, commodity index volatility, changes in interest rates or factors affecting a particular industry or commodity.
Products that invest in commodities may employ more complex strategies which may expose investors to additional risks.
Investing in fixed income securities involves certain risks such as market risk if sold prior to maturity and credit risk especially if investing in high yield bonds, which have lower ratings and are subject to greater volatility. All fixed income investments may be worth less than original cost upon redemption or maturity. Bond Prices fluctuate inversely to changes in interest rates. Therefore, a general rise in interest rates can result in the decline of the value of your investment.
Definitions
MSCI- EAFE: The Morgan Stanley Capital International Europe, Australasia and Far East Index, a free float-adjusted market capitalization index that is designed to measure developed-market equity performance, excluding the United States and Canada.
MSCI-Emerging Markets: The Morgan Stanley Capital International Emerging Market Index, is a free float-adjusted market capitalization index that is designed to measure the performance of global emerging markets of about 25 emerging economies.
Russell 3000: The Russell 3000 measures the performance of the 3000 largest US companies based on total market capitalization and represents about 98% of the investible US Equity market.
ML BOFA US Corp Mstr [Merill Lynch US Corporate Master]: The Merrill Lynch Corporate Master Market Index is a statistical composite tracking the performance of the entire US corporate bond market over time.
ML Muni Master [Merill Lynch US Corporate Master]: The Merrill Lynch Municipal Bond Master Index is a broad measure of the municipal fixed income market.
Investors cannot directly purchase any index.
LIBOR, London Interbank Offered Rate, is the rate of interest at which banks offer to lend money to one another in the wholesale money markets in London.
The Dow Jones Industrial Average is an unweighted index of 30 “blue-chip” industrial U.S. stocks.
The S&P Midcap 400 Index is a capitalization-weighted index measuring the performance of the mid-range sector of the U.S. stock market, and represents approximately 7% of the total market value of U.S. equities. Companies in the Index fall between S&P 500 Index and the S&P SmallCap 600 Index in size: between $1-4 billion.
DJ Equity REIT Index represents all publicly traded real estate investment trusts in the Dow Jones U.S. stock universe classified as Equity REITs according to the S&P Dow Jones Indices REIT Industry Classification Hierarchy. These companies are REITSs that primarily own and operate income-producing real estate.