
Value Stocks Continue to Lead
Market Overview
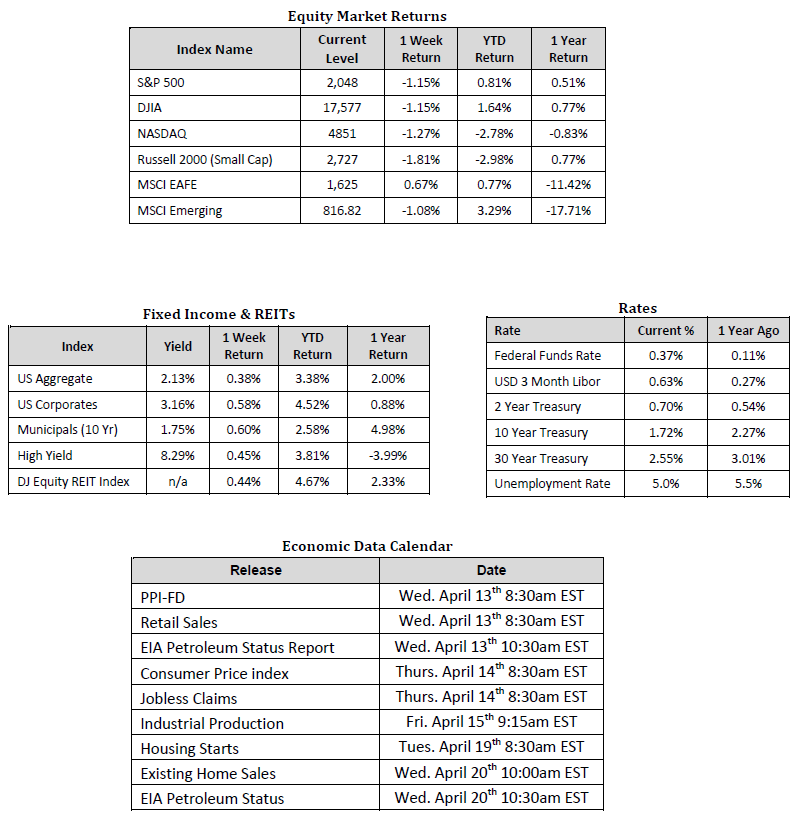
Sources: Equity Market, Fixed Income and REIT returns from JP Morgan as of 04/15/16. Rates and Economic Calendar Data from Bloomberg as of 04/18/16.
Happening Now
Stocks around the world rebounded last week led again by emerging markets* which gained 3.7% over the five day trading session. Developed international markets* outpaced U.S. equities with a gain of 3.6% versus the 1.7% increase witnessed in the S&P 500 Index. For the year, developed international markets have clawed back most of what was lost during the first quarter and now are down less than one percent. Emerging markets continue to be the strongest region year-to-date with a gain of 7.1% since the start of the year. The S&P 500 Index, for comparison, is now up 2.5% for 2016.
Within the U.S., a continued divergence is taking place in performance between growth and value companies. In order for a company to fall into the growth camp it typically must show a history of growth in earnings and/or sales and, in most cases, it will put earnings back into the company rather than payout dividends to shareholders. Value companies, conversely, earn their title by generally having a low stock price relative to the amount of equity in the company or the amount of earnings/sales the company generates. In other words, value companies have a lower price-to-book (P/B), price-to-sales (P/S), and/or price-to-earnings (P/E) ratios than the overall market.
As an example of changing market leadership overall thus far in 2016, U.S. value stocks have outperformed growth stocks across all capitalizations. Consider the table below:

In an environment of lower economic growth and persistently low interest rates, the market appears to currently be rewarding companies with value characteristics.
An additional point of consideration is the sectors generally associated with value companies. In the Russell 1000 Value Index, Financial Services, Energy, and Utilities together represent nearly 43% of the Index versus the 6% they represent in the Russell 1000 Growth Index. Alternatively, Consumer Cyclical, Technology, and Healthcare companies make up 60% of the Russell 1000 Growth Index compared to the 28% they represent in the Russell 1000 Value Index. Dividend yields are another differentiating factor between these two “groups” of stocks, for example the Russell 1000 Value Index yields 2.4% versus the 1.4% generated by stocks in the Russell 1000 Growth Index.
Given the differences in performance, risk factors and sector exposure, investors must consider how “balanced” their stock investments are and only look to over or under-weight each group after a thoughtful review process. Far too often we find investors tilted to value or growth companies without ever realizing it.
*U.S. Stocks are represented by the S&P 500 Index. Developed Markets are represented by the MSCI EAFE Index. Emerging Markets are represented by the MSCI EM Index. The following indexes were used to generate returns in the table value/growth/blend table: Large Cap Value – Russell 1000 Value. Large Cap Growth – Russell 1000 Growth Index. Large Cap Blend – S&P 500 Index. Mid Cap Value – Russell Mid Cap Value Index. Mid Cap Growth – Russell Mid Cap Growth Index. Mid Cap Blend – Russell Mid Cap Index. Small Cap Value – Russell 2000 Value Index. Small Cap Growth – Russell 2000 Growth Index. Small Cap Blend – Russell 2000 Index.
**All indexes are measured on a total return basis. It is not possible to invest directly in an index.
Important Information and Disclaimers
Disclosures: Hennion & Walsh is the sponsor of SmartTrust® Unit Investment Trusts (UITs). For more information on SmartTrust® UITs, please visit www.smarttrustuit.com. The overview above is for informational purposes and is not an offer to sell or a solicitation of an offer to buy any SmartTrust® UITs. Investors should consider the Trust’s investment objective, risks, charges and expenses carefully before investing. The prospectus contains this and other information relevant to an investment in the Trust and investors should read the prospectus carefully before they invest.
Investing in foreign securities presents certain risks not associated with domestic investments, such as currency fluctuation, political and economic instability, and different accounting standards. This may result in greater share price volatility. These risks are heightened in emerging markets.
There are special risks associated with an investment in real estate, including credit risk, interest rate fluctuations and the impact of varied economic conditions. Distributions from REIT investments are taxed at the owner’s tax bracket.
The prices of small company and mid cap stocks are generally more volatile than large company stocks. They often involve higher risks because smaller companies may lack the management expertise, financial resources, product diversification and competitive strengths to endure adverse economic conditions.
Investing in commodities is not suitable for all investors. Exposure to the commodities markets may subject an investment to greater share price volatility than an investment in traditional equity or debt securities. Investments in commodities may be affected by changes in overall market movements, commodity index volatility, changes in interest rates or factors affecting a particular industry or commodity.
Products that invest in commodities may employ more complex strategies which may expose investors to additional risks.
Investing in fixed income securities involves certain risks such as market risk if sold prior to maturity and credit risk especially if investing in high yield bonds, which have lower ratings and are subject to greater volatility. All fixed income investments may be worth less than original cost upon redemption or maturity. Bond Prices fluctuate inversely to changes in interest rates. Therefore, a general rise in interest rates can result in the decline of the value of your investment.
Definitions
MSCI- EAFE: The Morgan Stanley Capital International Europe, Australasia and Far East Index, a free float-adjusted market capitalization index that is designed to measure developed-market equity performance, excluding the United States and Canada.
MSCI-Emerging Markets: The Morgan Stanley Capital International Emerging Market Index, is a free float-adjusted market capitalization index that is designed to measure the performance of global emerging markets of about 25 emerging economies.
Russell 3000: The Russell 3000 measures the performance of the 3000 largest US companies based on total market capitalization and represents about 98% of the investible US Equity market.
ML BOFA US Corp Mstr [Merill Lynch US Corporate Master]: The Merrill Lynch Corporate Master Market Index is a statistical composite tracking the performance of the entire US corporate bond market over time.
ML Muni Master [Merill Lynch US Corporate Master]: The Merrill Lynch Municipal Bond Master Index is a broad measure of the municipal fixed income market.
Investors cannot directly purchase any index.
LIBOR, London Interbank Offered Rate, is the rate of interest at which banks offer to lend money to one another in the wholesale money markets in London.
The Dow Jones Industrial Average is an unweighted index of 30 “blue-chip” industrial U.S. stocks.
The S&P Midcap 400 Index is a capitalization-weighted index measuring the performance of the mid-range sector of the U.S. stock market, and represents approximately 7% of the total market value of U.S. equities. Companies in the Index fall between S&P 500 Index and the S&P SmallCap 600 Index in size: between $1-4 billion.
DJ Equity REIT Index represents all publicly traded real estate investment trusts in the Dow Jones U.S. stock universe classified as Equity REITs according to the S&P Dow Jones Indices REIT Industry Classification Hierarchy. These companies are REITSs that primarily own and operate income-producing real estate.