Capital Markets Update – Week of 1/12/2015
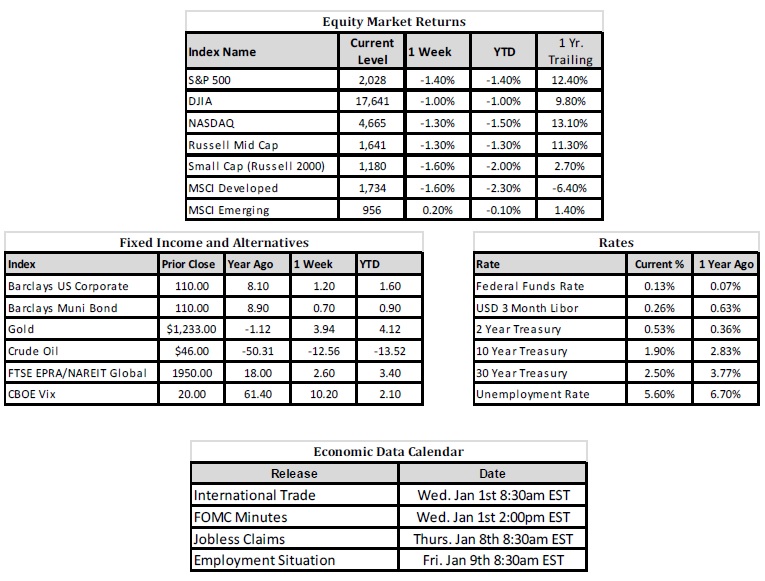
Market Overview

Sources: Rates Data and Economic Calendar—Bloomberg Markets as of 1/13/15; Equity Market Returns and Fixed Income and Alternatives Data—Wells Fargo Advisers as of 1/12/15.
Happening Now
Volatility Returns in 2015
U.S. markets have begun 2015 on a volatile note with the S&P 500 down over 2% for the year and the volatility index, or VIX, up over 11% at the time of this writing. After coming off a strong 2014 when the S&P 500 finished with a return of over 13%, the spike in volatility and subsequent sell off in equities will likely catch the attention of investors. We, at SmartTrust®, also note that not only are we seeing stocks sell off but we are also seeing yields on the 10 year U.S. Treasury in the sub 2% range – a level not breached since May 21 of 2013. This was the day before former Fed Chairman Ben Bernanke announced before Congress that the Fed would begin considering reducing the amount of their monthly bond purchases.
The infamous taper process has since concluded and in a year where many economists are forecasting the first fed rate hike in more than 8 years, it is interesting to see yields fall and bonds move up in price thus far in 2015. With the increase in price of other safe haven assets such as gold, which is up over 5% this year, it is likely that we are in the midst of a flight to quality spurred by the continued uncertainties in the falling price of oil, less than encouraging economic data (such as Friday’s disappointing report on wage growth), and conservative positioning ahead of a crucial earnings season.
As you may recall from previous posts, we, at SmartTrust®, believe that we are in the midst of a secular bull market and expect positive returns from equities over the intermediate to long term. With this being said, we expect investors to have to stomach more normal levels of volatility this year. We are seeing volatility already come into play and Bloomberg points out in a January 13th article that the S&P 500 index has moved an average of 1.08 percent per day in 2015, more than double the average daily price change in 20141.
Important Information and Disclaimers
Past Performance is not a guarantee of future performance.
Investing in foreign securities presents certain risks not associated with domestic investments, such as currency fluctuation, political and economic instability, and different accounting standards. This may result in greater share price volatility. These risks are heightened in emerging markets.
There are special risks associated with an investment in real estate, including credit risk, interest rate fluctuations and the impact of varied economic conditions. Distributions from REIT investments are taxed at the owner’s tax bracket.
The prices of small company and mid cap stocks are generally more volatile than large company stocks. They often involve higher risks because smaller companies may lack the management expertise, financial resources, product diversification and competitive strengths to endure adverse economic conditions.
Investing in commodities is not suitable for all investors. Exposure to the commodities markets may subject an investment to greater share price volatility than an investment in traditional equity or debt securities. Investments in commodities may be affected by changes in overall market movements, commodity index volatility, changes in interest rates or factors affecting a particular industry or commodity.
Products that invest in commodities may employ more complex strategies which may expose investors to additional risks.
Investing in fixed income securities involves certain risks such as market risk if sold prior to maturity and credit risk especially if investing in high yield bonds, which have lower ratings and are subject to greater volatility. All fixed income investments may be worth less than original cost upon redemption or maturity. Bond Prices fluctuate inversely to changes in interest rates. Therefore, a general rise in interest rates can result in the decline of the value of your investment.
Definitions
MSCI- EAFE: The Morgan Stanley Capital International Europe, Australasia and Far East Index, a free float-adjusted market capitalization index that is designed to measure developed-market equity performance, excluding the United States and Canada.
MSCI-Emerging Markets: The Morgan Stanley Capital International Emerging Market Index, is a free float-adjusted market capitalization index that is designed to measure the performance of global emerging markets of about 25 emerging economies.
Russell 3000: The Russell 3000 measures the performance of the 3000 largest US companies based on total market capitalization and represents about 98% of the investible US Equity market.
ML BOFA US Corp Mstr [Merill Lynch US Corporate Master]: The Merrill Lynch Corporate Master Market Index is a statistical composite tracking the performance of the entire US corporate bond market over time.
ML Muni Master [Merill Lynch US Corporate Master]: The Merrill Lynch Municipal Bond Master Index is a broad measure of the municipal fixed income market.
Investors cannot directly purchase any index.
LIBOR, London Interbank Offered Rate, is the rate of interest at which banks offer to lend money to one another in the wholesale money markets in London.
The Dow Jones Industrial Average is an unweighted index of 30 “blue-chip” industrial U.S. stocks.
The S&P Midcap 400 Index is a capitalization-weighted index measuring the performance of the mid-range sector of the U.S. stock market, and represents approximately 7% of the total market value of U.S. equities. Companies in the Index fall between S&P 500 Index and the S&P SmallCap 600 Index in size: between $1-4 billion.
DJ Equity REIT Index represents all publicly traded real estate investment trusts in the Dow Jones U.S. stock universe classified as Equity REITs according to the S&P Dow Jones Indices REIT Industry Classification Hierarchy. These companies are REITSs that primarily own and operate income-producing real estate.