Bond Yields Remain Top of Mind
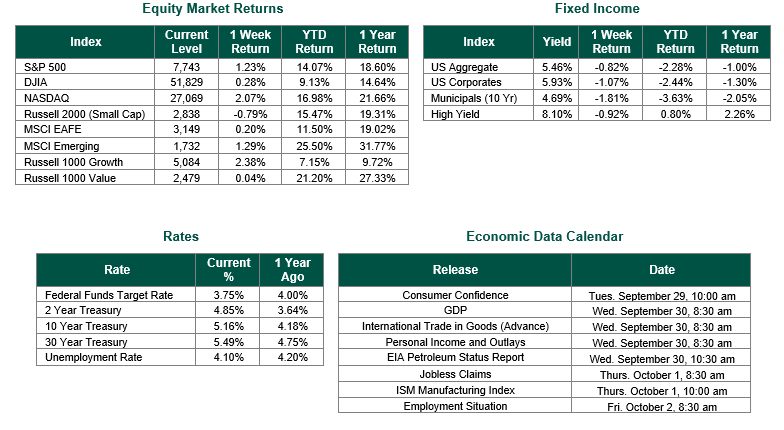
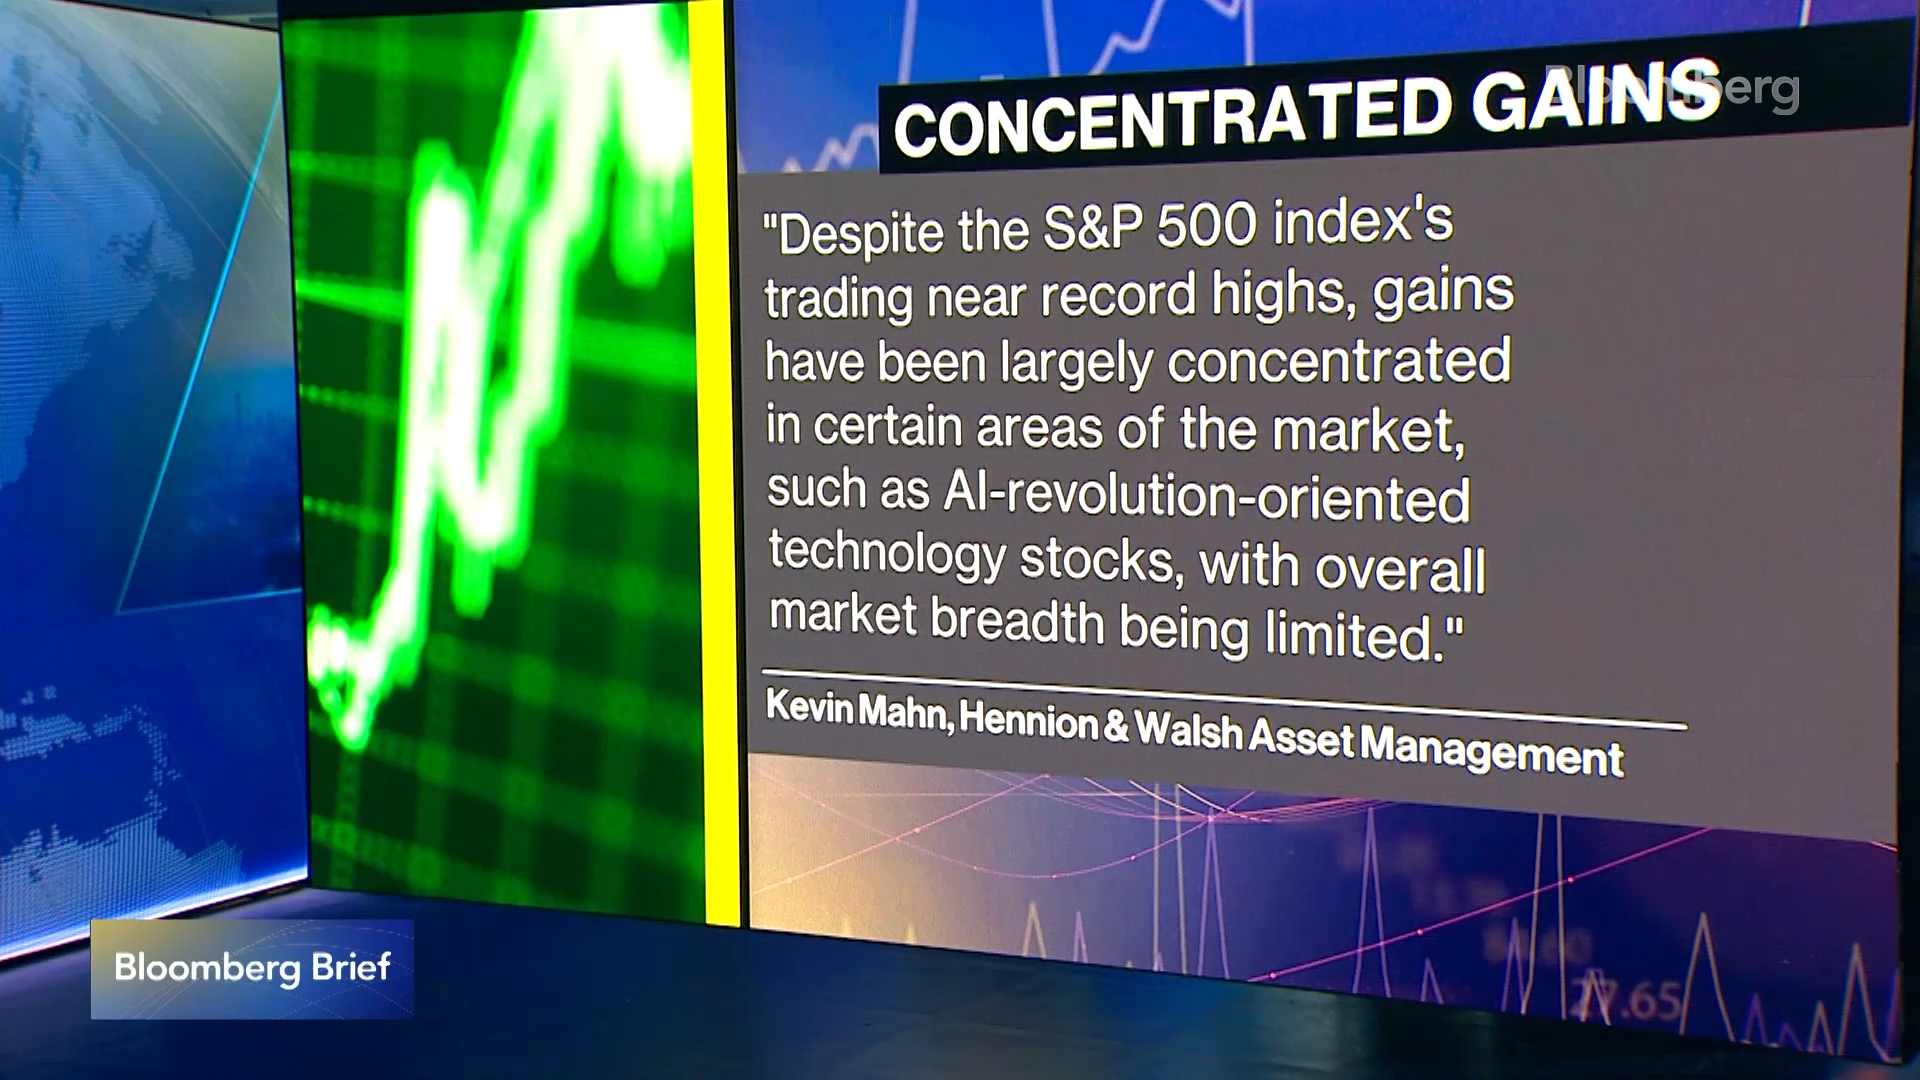
Global equity markets finished mixed for the week. In the U.S., the S&P 500 Index closed the week at a level of 7743, representing an increase of 1.23%, while the Russell Midcap Index moved +0.02% last week. Meanwhile, the Russell 2000 Index, a measure of the Nation’s smallest publicly traded firms, returned -0.79% over the week. As developed international equity performance and emerging markets were positive, returning +0.20% and +1.29%, respectively. Finally, the 10-year U.S. Treasury yield moved higher, closing the week at 5.16%.
U.S. equities finally returned to positive territory after two consecutive weekly declines, as easing oil prices and renewed enthusiasm around the artificial intelligence revolution helped markets absorb a further sharp move higher in U.S. Treasury yields. With respect to the latter, the 10-year Treasury yield closed the week at its highest level since July 2007, driven higher midweek by stronger-than-expected Purchasing Managers Index (PMI) data and hawkish commentary from Federal Reserve officials, before the yields on longer-dated Treasuries retreated modestly on Friday alongside falling oil prices.
The move in the bond market remains the most consequential storyline for investors. In addition to the 10-year, the 2-year U.S. Treasury yield rose to roughly 4.81%, and the 30-year approached 5.50%, keeping long-dated Treasuries near their highest levels of the modern rate cycle. Our analysis of the move suggests that the pressure on bonds is coming primarily from stronger growth expectations, a more hawkish Federal Reserve outlook, and increased overall supply in the bond market, rather than a resurgence in long-term inflation expectations. Fed Governor Michael Barr indicated that further policy adjustments are likely needed, and comments from other officials reinforced the sense that the September rate hike may not be the last of 2026. Following the September FOMC meeting, which raised the federal funds target range to 3.75%-4.00%, futures markets now price in a meaningful probability of another quarter-point increase before year-end.
On the geopolitical front, the tone shifted toward a more constructive tone as the week progressed. Iran’s president delivered a speech at the United Nations early in the week that further reduced hopes for a near-term resolution to the war, sending oil back above $100 per barrel midweek. By Friday, however, reports emerged of a potential phased U.S.-Iran agreement to reopen the Strait of Hormuz, with Iran indicating a willingness to allow tanker traffic to resume within seven days. Oil retraced meaningfully in response, closing the week back below $98, and the improved risk appetite that followed helped equities finish the week on a stronger footing. All of these events, however, occurred ahead of President Trump’s informal rejection of Iran’s proposal. Separately, the meeting between President Trump and Chinese President Xi Jinping produced some minor reported tariff concessions, but no substantive trade breakthroughs. However, the tone of the exchange was generally viewed as constructive and did little to derail sentiment.
Looking ahead to the week ahead, the calendar shifts squarely to the labor market, with the September nonfarm payrolls report this Friday standing out as the marquee data point. Consensus estimates are looking for job gains in the neighborhood of 50,000 following August’s much stronger 162,000 print, with the unemployment rate expected to hold steady at 4.1%. Ahead of the payrolls release, JOLTS job openings data on Wednesday, the ADP private employment report on Thursday, and the ISM manufacturing and services surveys will provide additional color on the overall health of the labor market and the broader economy. Federal Reserve commentary will also remain in focus, with a heavy schedule of speeches from FOMC members likely to further shape expectations for the October and December meetings.
Best wishes to all for the week ahead!
Equity and Fixed Income Index returns sourced from Bloomberg on 9/25/26. International developed markets are measured by the MSCI EAFE Index, emerging markets are measured by the MSCI EM Index, and U.S. Large Caps are defined by the S&P 500 Index. Sector performance is measured using the GICS methodology.
Disclosures: Past performance does not guarantee future results. We have taken this information from sources that we believe to be reliable and accurate. Hennion and Walsh cannot guarantee the accuracy of said information and cannot be held liable. You cannot invest directly in an index. Diversification can help mitigate the risk and volatility in your portfolio, but does not ensure a profit or guarantee against a loss.