
Equities Rally on Earnings Strength; CPI in Focus This Week
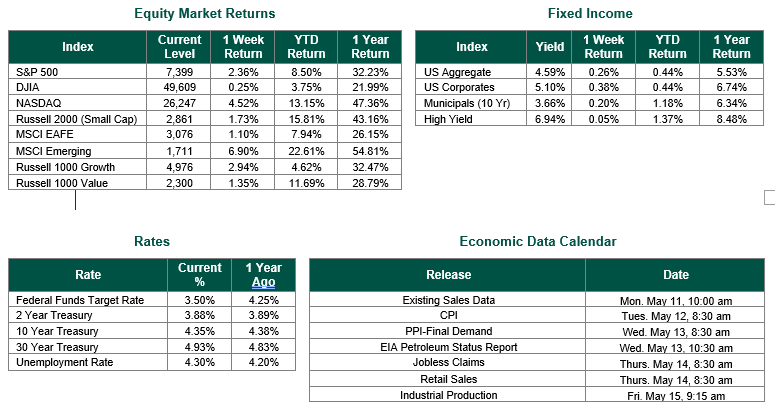
Global equity markets finished higher for the week. In the U.S., the S&P 500 Index closed the week at a level of 7399, representing an increase of 2.36%, while the Russell Midcap Index moved +1.19% last week. Meanwhile, the Russell 2000 Index, a measure of the Nation’s smallest publicly traded firms, returned +1.73% over the week. As developed international equity performance and emerging markets were positive, returning 1.10% and 6.90%, respectively. Finally, the 10-year U.S. Treasury yield moved higher, closing the week at 4.35%.
Equity markets rallied last week, buoyed by strong corporate earnings. As of May 7, roughly 85% of the S&P 500 Index had reported quarterly results, and FactSet data indicated that a little less than 85% of those companies announced earnings that topped the consensus estimate. In aggregate, the magnitude of the positive earnings surprise was about 19%. Within the S&P 500, information technology led the way, lifted by encouraging news flow for companies exposed to artificial intelligence infrastructure and consumption. The energy and utilities sectors, however, lost ground.
New claims for unemployment benefits came in at 200,000 for the week ended May 2, compared with 190,000 in the preceding period and below a consensus estimate of 205,000. Continuing claims, the number of people receiving jobless benefits, slipped to 1.77 million, the lowest level since 2024. Nonfarm payrolls in April increased for the second consecutive month. The U.S. economy added 115,000 jobs, well ahead of the 62,000 consensus, with gains in health care, transportation and warehousing, and retail the notable drivers. Payroll growth for March was revised higher to 185,000 from the previous estimate of 178,000, marking the strongest two-month period for nonfarm payroll increases since 2024. The unemployment rate held steady at 4.3%. However, the labor force participation rate fell to the lowest level since October 2021, a reminder that the headline gains have come alongside a shrinking pool of available workers.
Monthly data from Challenger, Gray & Christmas indicated that announced layoffs increased 38% sequentially in April but declined 21% year over year. Information technology companies announced the most job cuts, with many firms attributing the reductions in force to AI. The latest data from the Bureau of Labor Statistics also showed that U.S. labor productivity gains, measured by nonfarm employee output per hour, slowed in the first quarter to a seasonally adjusted annualized rate of 0.8%, down sharply from the 1.6% increase logged in the final three months of 2024. Year over year, labor productivity still increased by a healthy 2.9%.
Census Bureau data indicated that U.S. construction spending rebounded by 0.6% in March after declining 0.2% month over month in February, with new single-family housing projects an area of strength. A separate Census Bureau report indicated that new orders for goods from U.S. factories increased 1.5% sequentially in March after growing 0.3% in February. Surging demand for electronic products was a key driver, reflecting the ongoing build-out of AI infrastructure; the same theme propelling the technology sector’s leadership in the equity market.
The data calendar this week is dense and will set the tone for the next four weeks heading into the June 16-17 FOMC meeting. April CPI on Tuesday is the most consequential print, particularly after March PCE re-accelerated to 3.5% year-over-year. Wednesday brings PPI and the weekly EIA petroleum report, Thursday delivers retail sales alongside jobless claims, and Friday closes with industrial production. With the Federal Funds target rate sitting at 3.50%, a full 75 basis points below where it was a year ago, the bar for the data to justify the Fed’s current easing bias is rising.
Best wishes to all for the week ahead.
Equity and Fixed Income Index returns sourced from Bloomberg on 5/08/26. International developed markets are measured by the MSCI EAFE Index, emerging markets are measured by the MSCI EM Index, and U.S. Large Caps are defined by the S&P 500 Index. Sector performance is measured using the GICS methodology.
Disclosures: Past performance does not guarantee future results. We have taken this information from sources that we believe to be reliable and accurate. Hennion and Walsh cannot guarantee the accuracy of said information and cannot be held liable. You cannot invest directly in an index. Diversification can help mitigate the risk and volatility in your portfolio but does not ensure a profit or guarantee against a loss.