Last Week’s Markets in Review: Fed’s Hawkish Tone Drives Market Volatility
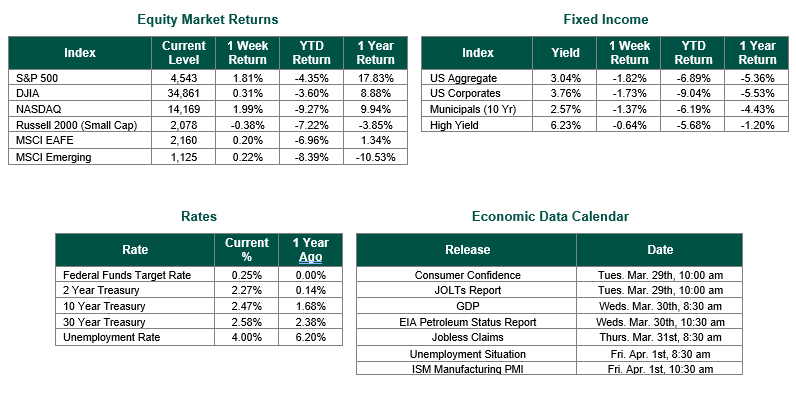
Global equity markets finished mostly higher for the week. In the U.S., the S&P 500 Index closed the week at a level of 4,543, representing a gain of 1.81%, while the Russell Midcap Index moved 0.98% higher last week. Meanwhile, the Russell 2000 Index, a measure of the Nation’s smallest publicly traded firms, returned -0.38% over the week. International equity performance was slightly higher as developed, and emerging markets returned 0.20% and 0.22%, respectively. Finally, the 10-year U.S. Treasury yield moved higher, closing the week at 2.47%.
Last week, Federal Reserve Chairman Powell continued to stay at the top of the economic news cycle. In a speech that Powell made at the National Association for Business Economics on Monday, 3/21, he increased his hawkish tone from the FOMC press conference from the week before. Powell stated, “We will take the necessary steps to ensure a return to price stability.” It is the following quote that may have moved the U.S. Treasuries yield curve the most, as Chair Powell went on to state, “If we conclude that it is appropriate to move more aggressively by raising the federal funds rate by more than 25 basis points at a meeting or meetings, we will do so. And if we determine that we need to tighten beyond common measures of neutral and into a more restrictive stance, we will do that as well.”
Equity markets reacted to Powell’s remarks with continued volatility throughout the week as market participants sought to determine if the domestic economy was robust enough to withstand the Fed’s ever-increasing desire to slow inflation and gain price stability. On Thursday, strong weekly jobless claims supported the position that the domestic economy is likely strong enough to withstand the restrictive monetary policy that the Fed plans to enact. In this regard, seasonally-adjusted claims fell 28,000 to 187,000 for the week ended March 19th, the lowest level since September 1969.
The U.S. Treasuries market responded to Powell’s remarks by continuing its march to higher yields. The yield for the 2-year Treasury moved from 2.02% at the beginning of the week to a high of 2.33% during the Friday trading day. Likewise, the 10-year Treasury began the week yielding 2.24% and achieved a high for the week of 2.50% on Friday.
Investors should consider all of the information and data discussed within this market update when managing their investment portfolios. However, with so much data and so little time to digest it all, we encourage investors to work with experienced financial professionals in order to build and manage the asset allocations within their portfolios consistent with their objectives, timeframe, and tolerance for risk.
Best wishes for the week ahead!
Employment data is sourced from the U.S. Department of Labor. Equity Market and Fixed Income returns are from JP Morgan as of 3/25/22. Rates and Economic Calendar Data from Bloomberg as of 3/25/22. International developed markets measured by the MSCI EAFE Index, emerging markets measured by the MSCI EM Index, U.S. Large Cap defined by the S&P 500. Sector performance is measured using the GICS methodology.
Disclosures: Past performance does not guarantee future results. We have taken this information from sources that we believe to be reliable and accurate. Hennion and Walsh cannot guarantee the accuracy of said information and cannot be held liable. You cannot invest directly in an index. Diversification can help mitigate the risk and volatility in your portfolio but does not ensure a profit or guarantee against a loss.
Diversification can help mitigate the risk and volatility in your portfolio but does not ensure a profit or guarantee against loss.
Investing in commodities is not suitable for all investors. Exposure to the commodities markets may subject an investment to greater share price volatility than an investment in traditional equity or debt securities. Investments in commodities may be affected by changes in overall market movements, commodity index volatility, changes in interest rates or factors affecting a particular industry or commodity.
Products that invest in commodities may employ more complex strategies which may expose investors to additional risks.
Investing in fixed income securities involves certain risks such as market risk if sold prior to maturity and credit risk, especially if investing in high yield bonds, which have lower ratings and are subject to greater volatility. All fixed income investments may be worth less than the original cost upon redemption or maturity. Bond Prices fluctuate inversely to changes in interest rates. Therefore, a general rise in interest rates can result in the decline of the value of your investment.
Definitions
MSCI- EAFE: The Morgan Stanley Capital International Europe, Australasia and Far East Index, a free float-adjusted market capitalization index that is designed to measure developed-market equity performance, excluding the United States and Canada.
MSCI-Emerging Markets: The Morgan Stanley Capital International Emerging Market Index, is a free float-adjusted market capitalization index that is designed to measure the performance of global emerging markets of about 25 emerging economies.
Russell 3000: The Russell 3000 measures the performance of the 3000 largest US companies based on total market capitalization and represents about 98% of the investible US Equity market.
ML BOFA US Corp Mstr [Merill Lynch US Corporate Master]: The Merrill Lynch Corporate Master Market Index is a statistical composite tracking the performance of the entire US corporate bond market over time.
ML Muni Master [Merill Lynch US Corporate Master]: The Merrill Lynch Municipal Bond Master Index is a broad measure of the municipal fixed income market.
Investors cannot directly purchase any index.
LIBOR, London Interbank Offered Rate, is the rate of interest at which banks offer to lend money to one another in the wholesale money markets in London.
The Dow Jones Industrial Average is an unweighted index of 30 “blue-chip” industrial U.S. stocks.
The S&P Midcap 400 Index is a capitalization-weighted index measuring the performance of the mid-range sector of the U.S. stock market and represents approximately 7% of the total market value of U.S. equities. Companies in the Index fall between S&P 500 Index and the S&P SmallCap 600 Index in size: between $1-4 billion.
DJ Equity REIT Index represents all publicly traded real estate investment trusts in the Dow Jones U.S. stock universe classified as Equity REITs according to the S&P Dow Jones Indices REIT Industry Classification Hierarchy. These companies are REITs that primarily own and operate income-producing real estate.