Last Week’s Markets in Review: Supply/Demand Dynamics of the Jobs Market
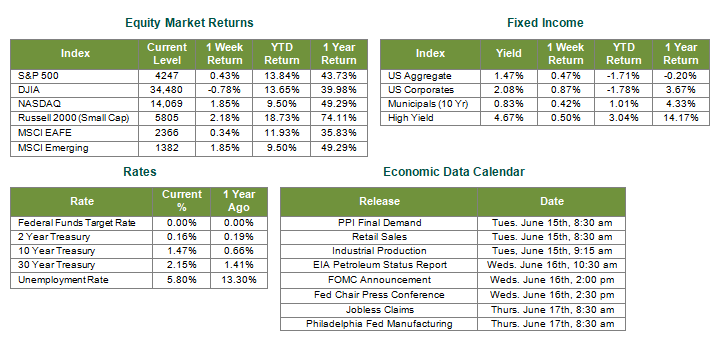
Global equity markets finished higher for the week. In the U.S., the S&P 500 Index (S&P 500) reached record highs and closed the week at a level of 4,247, representing a gain of 0.43%, while the Russell Midcap Index moved 0.33% higher last week. Meanwhile, the Russell 2000 Index, a measure of the Nation’s smallest publicly traded firms, returned 2.18% over the week. International equity performance was also positive as developed, and emerging markets returned 0.46% and 1.85%, respectively. Finally, the 10-year U.S. Treasury yield ticked lower, closing the week at 1.47%.
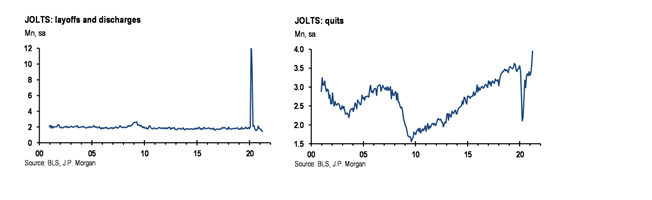
On Tuesday, the U.S Bureau of Labor Statistics released the April 2021 Job Opening and Labor Turnover Summary, also referred to as JOLTS. The release showed an astonishing 6% rise (vs. the median forecast of -1%) to the job opening level reaching a total of 9.3 million openings. In addition to job openings, the report also draws attention to the number of new hires and separations (i.e quits, layoffs and discharges). The new hire rate remained unchanged for the period at 4.2%, while total separations were little changed at 4.0%. Interestingly, 4 million, or 68.9%, of total separations in April were attributed to “voluntary quits” while in April 2020 nearly 78% of total separations were attributed to layoffs. This drastic flip from layoff to quit separations comes as no surprise to many as pandemic-driven business closures have now transitioned to economic reopening. The below charts from JP Morgan, show a great representation of the flip in total separation.
The question remains as to why during a period of such profound economic recovery that the steepness and level of quits increased to above pre-pandemic levels? According to Goldman Sachs, the mismatch in labor market supply remains suppressed due to three main drivers; early retirement, lingering health concerns, and unemployment benefits. The latter, we believe, is the most relevant cause to the recent “quits” phenomena as those who voluntarily quit are not eligible for unemployment benefits.
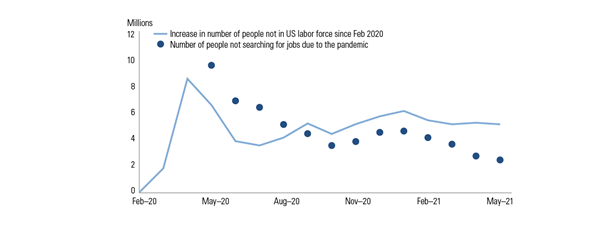
With the $1.9 Trillion American Rescue Plan Act signed by President Biden on March 11, 2021, the extension of an additional $300 of unemployment benefits through September 6, 2021, could potentially continue to have a negative effect on the labor supply and the labor force’s willingness to take jobs, which is represented in the below chart from Goldman Sachs. This negative effect, however, may not suppress labor markets much longer as various states have come forward in denying benefits for those not able to provide proof of an attempt at entering/re-entering the workforce.
Although there was some weakness within the recent jobs report, we believe that this weakness is primarily due to a diminished need to enter the workforce right away. With increasing job openings, increased vaccinations leading to decreased health concerns in the workplace, and increased unemployment benefits ending in the coming months, the forward-looking employment prospects are promising. This positive outlook on employment creates a bullish forecast for continued economic recovery and sustained growth in domestic markets.
Although the data discussed above does seem promising, we do believe that the days of short-term bouts of volatility are not behind us. Accordingly, we encourage investors to work with experienced financial professionals to discuss these types of market risks. It is ever more important now to ensure portfolios are consistent with their objectives, timeframe and risk tolerance.
Best wishes for the week ahead!
Sources for data in tables: Job opening and labor turnover data from the Bureau of Labor Statistics on 6/11/21. Charts on Job openings and quits from JP Morgan on 6/11/21. Chart on US Labor Force from Goldman Sachs on 6/11/2021.
Disclosures: Past performance does not guarantee future results. We have taken this information from sources that we believe to be reliable and accurate. Hennion and Walsh cannot guarantee the accuracy of said information and cannot be held liable. You cannot invest directly in an index. Diversification can help mitigate the risk and volatility in your portfolio but does not ensure a profit or guarantee against a loss.
Diversification can help mitigate the risk and volatility in your portfolio but does not ensure a profit or guarantee against loss.
Investing in commodities is not suitable for all investors. Exposure to the commodities markets may subject an investment to greater share price volatility than an investment in traditional equity or debt securities. Investments in commodities may be affected by changes in overall market movements, commodity index volatility, changes in interest rates or factors affecting a particular industry or commodity.
Products that invest in commodities may employ more complex strategies which may expose investors to additional risks.
Investing in fixed income securities involves certain risks such as market risk if sold prior to maturity and credit risk especially if investing in high yield bonds, which have lower ratings and are subject to greater volatility. All fixed income investments may be worth less than the original cost upon redemption or maturity. Bond Prices fluctuate inversely to changes in interest rates. Therefore, a general rise in interest rates can result in the decline of the value of your investment.
Definitions
MSCI- EAFE: The Morgan Stanley Capital International Europe, Australasia and Far East Index, a free float-adjusted market capitalization index that is designed to measure developed-market equity performance, excluding the United States and Canada.
MSCI-Emerging Markets: The Morgan Stanley Capital International Emerging Market Index, is a free float-adjusted market capitalization index that is designed to measure the performance of global emerging markets of about 25 emerging economies.
Russell 3000: The Russell 3000 measures the performance of the 3000 largest US companies based on total market capitalization and represents about 98% of the investible US Equity market.
ML BOFA US Corp Mstr [Merill Lynch US Corporate Master]: The Merrill Lynch Corporate Master Market Index is a statistical composite tracking the performance of the entire US corporate bond market over time.
ML Muni Master [Merill Lynch US Corporate Master]: The Merrill Lynch Municipal Bond Master Index is a broad measure of the municipal fixed income market.
Investors cannot directly purchase any index.
LIBOR, London Interbank Offered Rate, is the rate of interest at which banks offer to lend money to one another in the wholesale money markets in London.
The Dow Jones Industrial Average is an unweighted index of 30 “blue-chip” industrial U.S. stocks.
The S&P Midcap 400 Index is a capitalization-weighted index measuring the performance of the mid-range sector of the U.S. stock market, and represents approximately 7% of the total market value of U.S. equities. Companies in the Index fall between S&P 500 Index and the S&P SmallCap 600 Index in size: between $1-4 billion.
DJ Equity REIT Index represents all publicly traded real estate investment trusts in the Dow Jones U.S. stock universe classified as Equity REITs according to the S&P Dow Jones Indices REIT Industry Classification Hierarchy. These companies are REITs that primarily own and operate income-producing real estate.